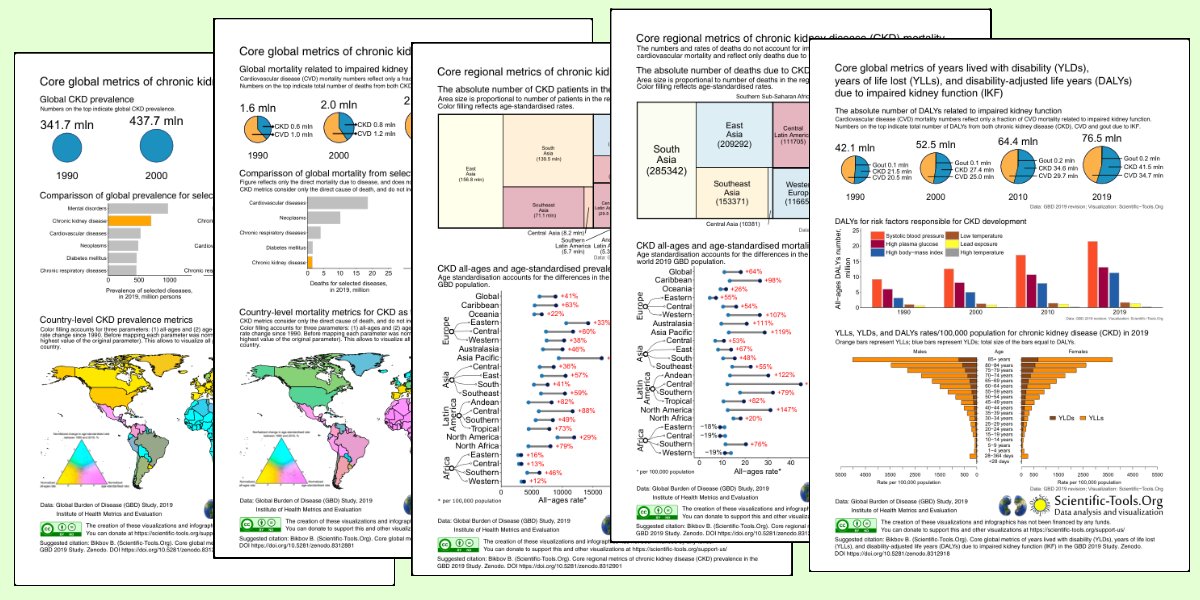
In today’s digital landscape, the way research is communicated can be just as critical as…
Visuals are essential tools for understanding, influencing decisions, and amplifying the impact of your work. At Scientific-Tools.Org, we specialize in creating scientific visuals that clarify complexity, support publication and funding success, and bring your message to life across print and digital platforms. From assisting with figure preparation for scientific publications to creating interactive visuals for broader audiences, we work closely with you to ensure your message is communicated clearly, accurately, and with compelling visual impact.
Figure Preparation — Ready for Journals and Reports
We produce clean, informative scientific figures that meet the formatting and resolution standards of top academic journals. From flowcharts and cohort diagrams to survival curves and multi-panel graphics, every element is designed to convey your data clearly while aligning with your manuscript’s narrative. Our experience with over 100 peer-reviewed publications ensures we understand what editors, reviewers, and readers expect — and how to meet those expectations with visual excellence.

Interactive Visualizations — Making Data Accessible and Exploratory
For digital reports, web dashboards, or data communication campaigns, we build interactive web-based visualizations that go beyond static charts. They are especially effective in our work with population-level data tools that designed to explore health indicators across European countries. Our interactive visualizations enhance understanding of variation across regions and over time, allow users to analyze trends, stratify results, and visualize complex public health data with clarity.
Presentation Design — Memorable and Meaningful
We design custom slide decks and visual assets for academic conferences, stakeholder meetings, CME lectures, and grant presentations. Our visuals are optimized for live delivery — not just to look good, but to support storytelling, engagement, and retention. Whether you’re briefing a government agency, delivering a keynote at a medical congress, or pitching a collaborative project, we help your visuals reflect the professionalism of your work.
Video Production — Animate, Explain, Inspire
Sometimes, a video is the best way to convey a concept. We offer data-driven video production, such as animations and voiceovers that guide viewers through key findings and methods. These are ideal for public communication, patient education, online training modules, and dissemination of complex research findings. Visual storytelling can dramatically increase reach and understanding by transforming raw data into engaging, memorable narratives that resonate with both professional and public audiences.
Transform Your Data into Visual Impact
If you need to move beyond raw numbers and static tables, we’re ready to support your goals and turn your data into visuals that communicate, resonate, and inform. From publication-quality graphics to interactive dashboards, we tailor our services to your research goals and audience needs. Contact us via our web form, LinkedIn, or email to discuss strategies for presenting your findings with clarity and impact.


Comments (0)