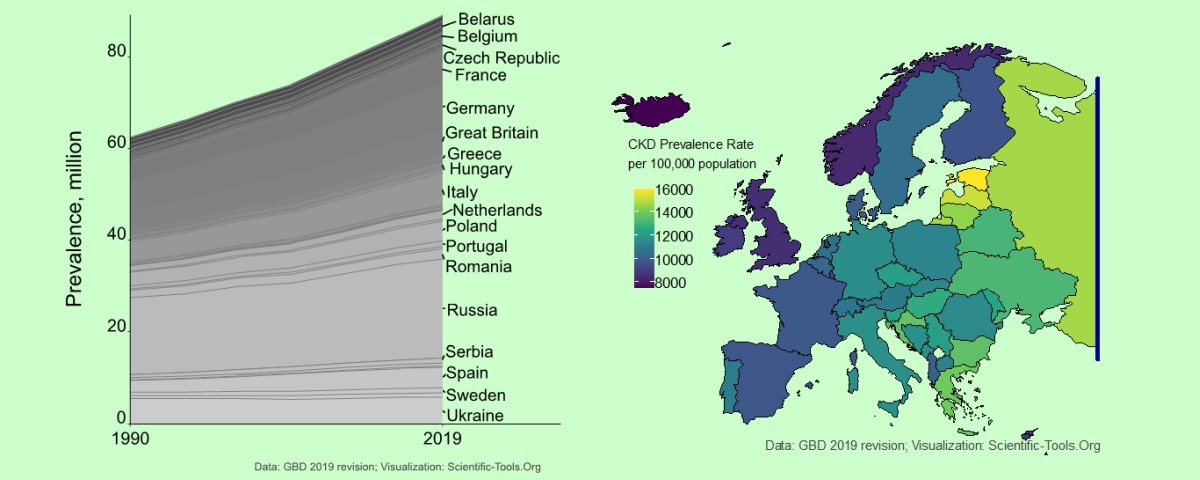
Visualization is the graphic presentation of data that allows to highlight complex information at a glance. Visualization is far beyond a bar plot, scatter plot, line graph, map, network graph, or any other figure type. Visualization is used for communication and storytelling, sharing your findings with others, with the ultimate goal to make better decisions together.
Scientific-Tools.Org helps you to find complex patterns in data and make them visible for further interpretation. Whether you work in science, business, or education – we can assist you in data visualization of all types. We are proficient in the visualization of quantitative data, geospatial data, and survey results. Visualizations performed by Scientific-Tools.Org staff reflect data from clinical studies, national and international economic organisations, large-scale real-world databases, disease registries, and population surveys. Our work is recognized by our clients and peers, and even received an award from the European Commission.
You have data – we know how to visualize them and bring you the maximum benefit. Feel free to contact us for a free consultation.

