
Scientific-Tools.Org staff developed VisImE-360, an app that uses open Eurostat data to facilitate health care planning for visual impairment. This app received a prestigious EU Datathon award, and the central Eurostat data.europa.eu portal included the app in the Use Case Observatory Report Volume I. If you are interested in a similar interactive data visualization, feel free to contact us.
VisImE-360 explains in a single information space the Eurostat´s data on visual impairment, helping to allocate resources for medical aid. It uses raw open Eurostat data to produce easy-to-percept text description, visualisations and tables. In this way, the application ultimately helps decision-makers to allocate resources for helping people with visual impairment and facilitate provision of the most appropriate medical aid.
The goal of VisImE-360 is twofold. On the one hand, it raises awareness about visual impairment, which is one of the most prevalent health conditions worldwide, affecting an increasing number of people. On the other hand, it supports a wide range of stakeholders – including policymakers, patient organisations and people with visual impairment, members of the media and social service workers – to take action and improve access to prevention and treatment.

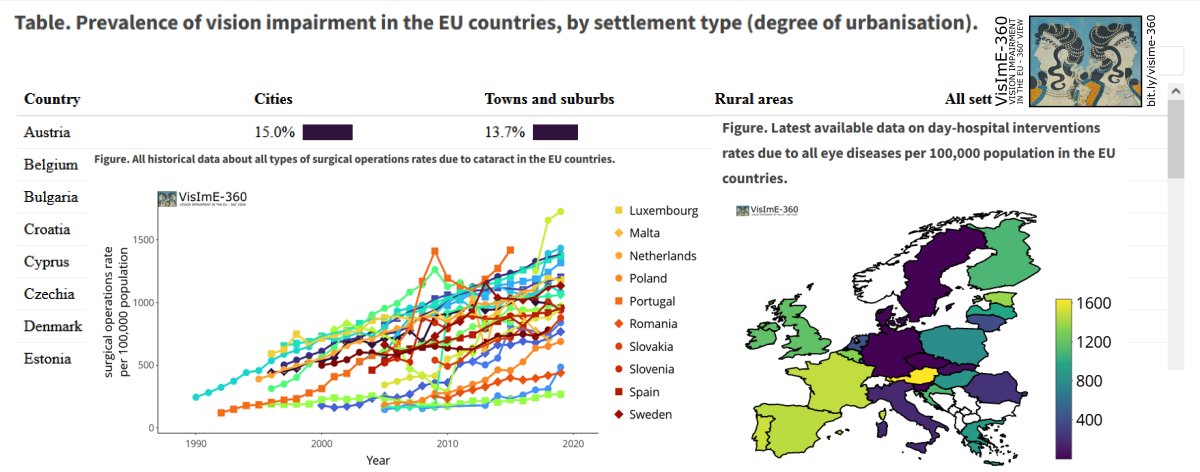
To do so, the application presents the user with two chapters. In the first chapter, it shows the number of people that suffer from vision impairment across EU countries and according to the degree of urbanisation (i.e., people living in cities, towns, or rural areas) as well as education (i.e., people with primary, secondary, and tertiary education). This is done through different tables, bar charts, and interactive maps. The second chapter focuses on healthcare resources and utilisation for vision impairment, including latest metrics on available ophthalmic surgeons in Europe, up-to-date statistics on surgical operations for cataract treatment across EU Member States, as well as data on day-hospital interventions and hospital discharges for all eye diseases. Dynamic line charts and tables help the user to draw comparisons between various countries in terms of prevalence and treatment patterns, and use them to plan public health actions.
To make all this information more accessible to all – including individuals with decreased visual perception, colour vision deficiency or colour blindness – VisImE-360 offers the possibility to select colour schemes and font features that better suit the user´s needs and allows a more comfortable experience. Written and visual guidelines on how to explore the application and its features are also available.
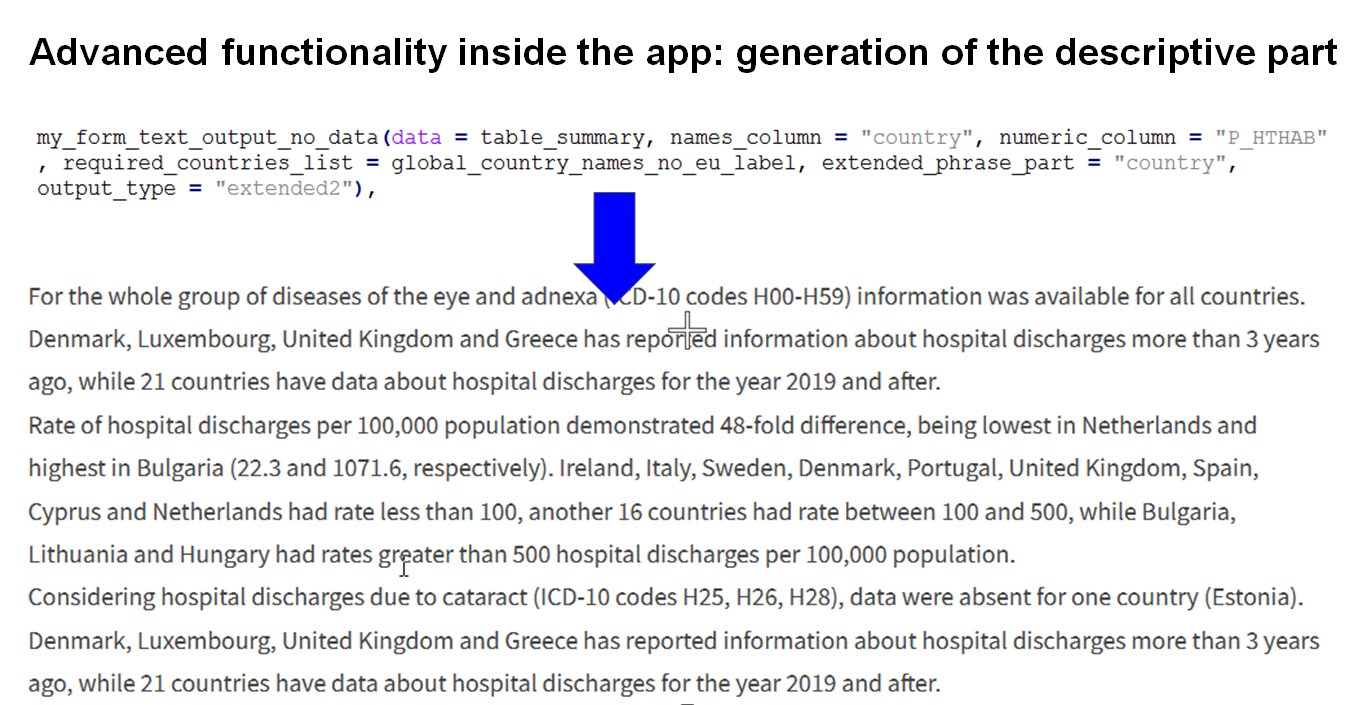
We supply the app with several innovative features, including a custom algorithm for generation of the data description that allows to produce a paragraph of high-quality text just by calling a single function.
VisImE-360 entirely relies on Eurostat data, scientific research studies, and other open data sources. To prepare the data and use it effectively for the application, Scientific-Tools.Org staff underwent a two-step process using the open-source R computing environment.
Firstly, we searched through the datasets of Eurostat. This was quite challenging because initial search indicated almost 300 datasets with topics related to vision impairment and disability. However, only some of them contained information of interest. While some datasets could be filtered based on the complete description, Scientific-Tools.Org staff has to manually review about 150 datasets and their dictionaries to find those really containing data on vision impairment. The application was ultimately constructed on 8 datasets.
The second part of the process entailed the preparation of all visualisations, tables, and figures to better reflect the richness of the open data retrieved from Eurostat. The major findings are also accompanied by a short text description that partially generated by a Scientific-Tools.Org data processing algorithm. Importantly, all information processing and visualisations are made by reproducible data science pipelines that facilitate their update upon new Eurostat releases in the following years. Through ad-hoc accessibility features and different kinds of graphs, VisImE-360 offers easy-to-percept statistics for everyone.


Comments (0)