
Chronic kidney disease (CKD) is an important contributor to morbidity and mortality from noncommunicable diseases, and is highly relevant topic in global health.
The Global Burden of Disease, Injuries and Risk Factors (GBD) study presents a comprehensive assessment of the global epidemiology of CKD both as a direct cause of mortality and morbidity and as a risk factor for other diseases. The GBD uses term “impaired kidney function (IKF)” to indicate the CKD as a risk factor for ischaemic heart disease, stroke, peripheral vascular disease, and gout, and underline the difference from the term “CKD” itself that refers to a direct cause of morbidity and mortality due to kidney disease.
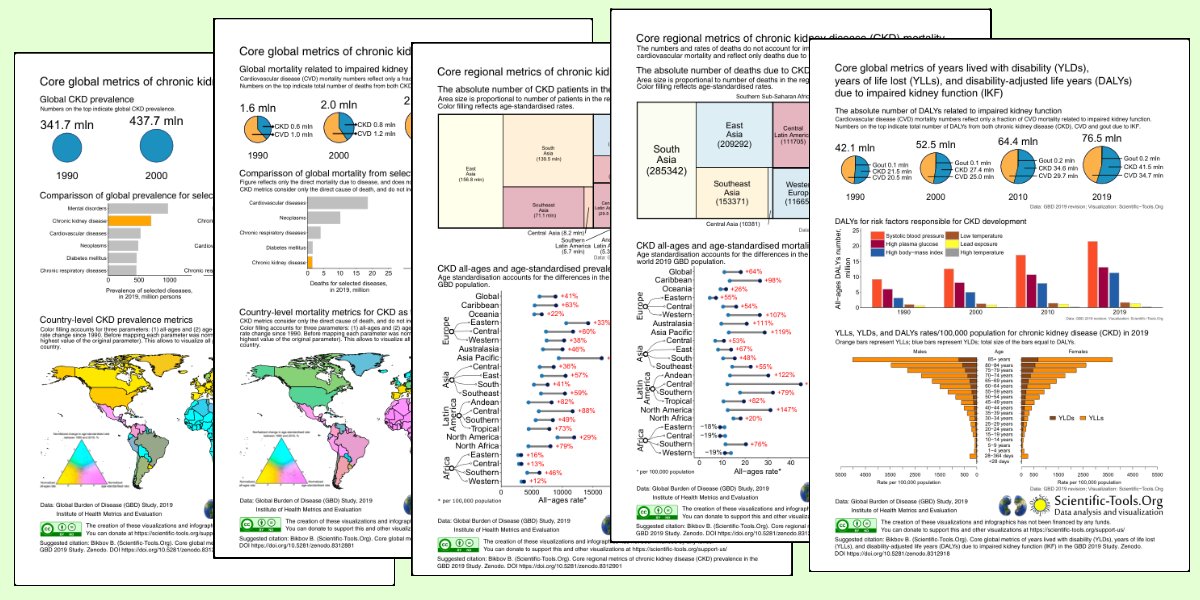
According to the Global Burden of Disease Study, CKD affected almost 700 million people worldwide and led to 3.2 million deaths in 2019, with 1.4 mln deaths directly caused by CKD, and 1.7 mln deaths occurred due to impaired kidney function as a risk factor for cardiovascular disease.
Despite this high burden, CKD is not included in health strategies in many countries. Scientific-Tools.Org created a series of infographics highlighting different aspects of CKD epidemiology at global, regional and country levels. The final goal of our infographics is not only to raise awareness and call for action by local health authorities – but to improve the availability of prevention and treatment measures for people in all countries.
Feel free to share and use these infographics under a Creative Commons Attribution NoDerivatives License.
The creation of these infographics is the one of our projects that are not funded by any source. If you like them – you can support us by several ways and help to implement this and ongoing projects.
Posters in A4 format:
- Core global metrics of chronic kidney disease (CKD) prevalence in the GBD 2019 Study
- Core global metrics of chronic kidney disease (CKD) mortality in the GBD 2019 Study
- Core regional metrics of chronic kidney disease (CKD) prevalence in the GBD 2019 Study
- Core regional metrics of chronic kidney disease (CKD) mortality in the GBD 2019 Study
- Core global metrics of years lived with disability (YLDs), years of life lost (YLLs), and disability-adjusted life years (DALYs) due to impaired kidney function (IKF) in the GBD 2019 Study
Power Point slides:
Posters for general public:


Comments (0)